
A first hand account of the horrific devastation of the Alberta wildfire written by a native of the region who is also a member of the FirstLook team at DigitalGlobe.
by Kevin Bullock
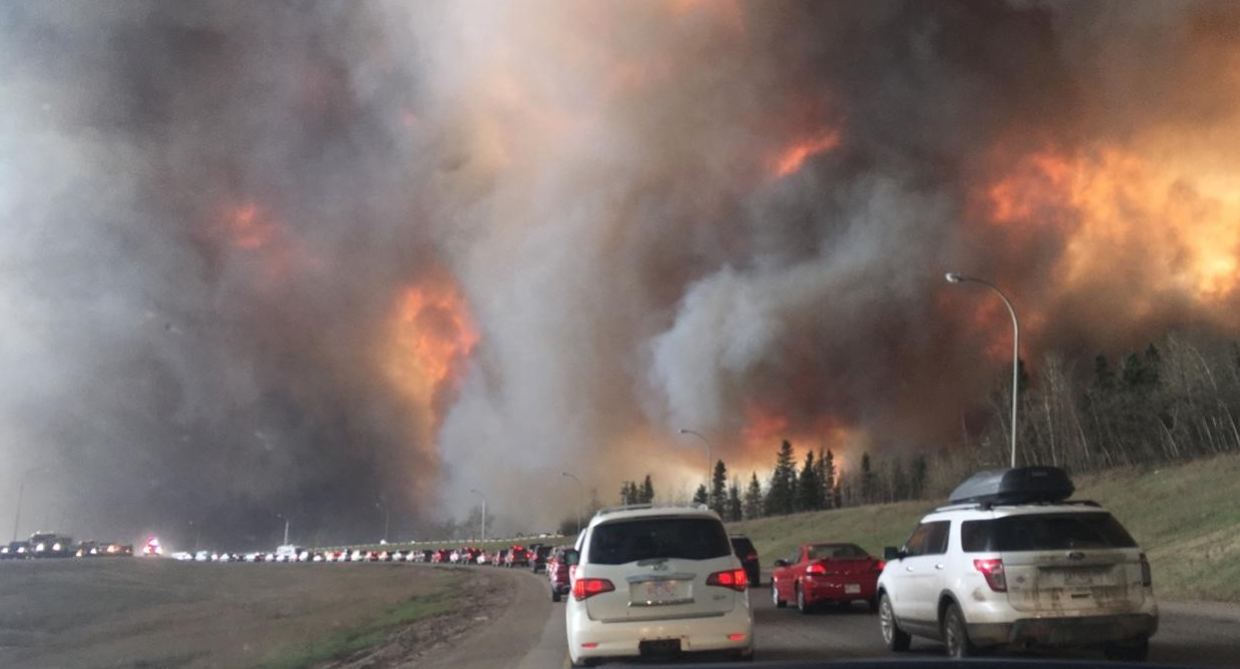
Evacuation along Highway 63, from Wikimedia Commons courtesy DarrenRD
If you’ve been online in the past few days, you’ve probably seen the horrific images of the massive wildfire that engulfed the city of Fort McMurray Alberta. Record setting heat, low humidity, very dry conditions and high winds kicked up a massive blaze on the outskirts of Fort McMurray earlier this week. It was over 32 degrees Celsius on Tuesday. I grew up in Calgary Alberta, 600 km south of Fort McMurray and temperatures this warm are very rare and usually only occur in July.
As the fire picked up early on Tuesday, our FirstLook team at DigitalGlobe started acquiring satellite imagery and we began tracking the fire from space. This was in the morning, at the time the fire was on the outskirts of the town and voluntary evacuations were taking place in a few neighborhoods. Things got crazy after that afternoon as winds blew in at 70km/hr, and the fire grew fast and unpredictable. A mandatory evacuation was put in place for the entire city. This is unprecedented; the fire is still burning and this is expected to be the costliest natural disaster in Canada’s recorded history. To put this in perspective, the worst disaster in Alberta’s history took place during the floods of 2013 and caused $1.8B in damage. This fire is expected to be over $9B.
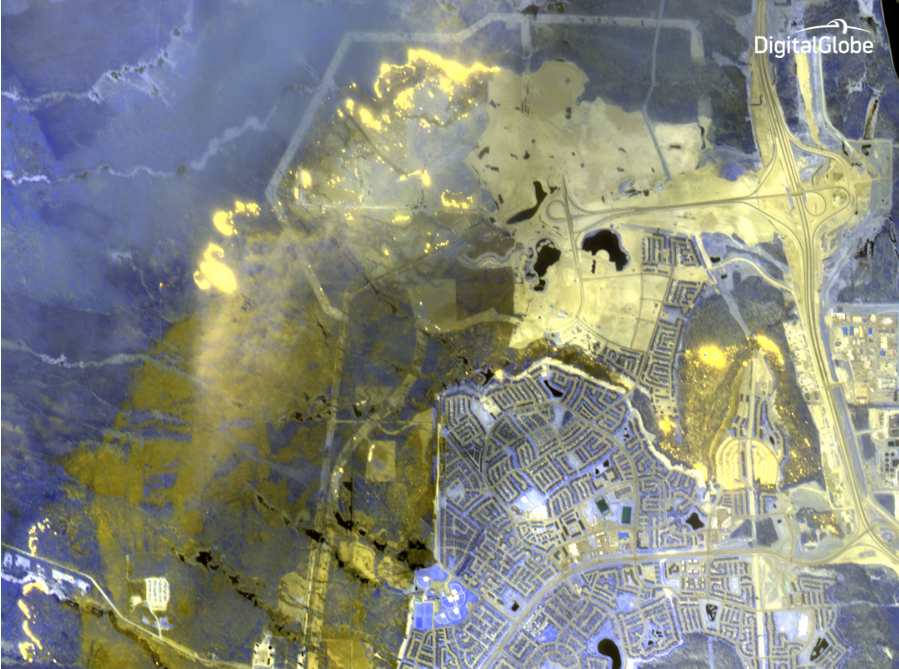
DigitalGlobe’s WorldView-3 satellite of the Wildfire in Alberta Canada WV-3 has the unique ability to peer through smoke using shortwave infrared technology to see what areas have been burned by the fire and where the hot spots are – imagery analysts can even measure the intensity of the fire. In these false-color images, the yellow areas are those that have been burned by the fire, the purple areas are healthy vegetation, and the bright spots are where the fire is actively burning. Image courtesy DigitalGlobe © 2016.
DigitalGlobe has collected imagery every day this week, from multiple satellites in order to track and analyze the growth, and identify damage. We are working with first responders, relief workers and provincial governments to ensure this data is in the hands of decision makers, and those who can make a difference on the ground. It is critical to understand the landscape in a time like this; actively identifying passable roads and impacted areas can save resources and time. As the fire continues to blaze, we are using short wave infrared imagery (SWIR) to “cut” through the smoke and identify the active footprint and burning hotspots. This can help mitigate additional flare-ups and help suppress the wildfire.
Sadly, over 1600 structures are expected to be lost at this point. Using infrared imagery from our satellites we can easily see healthy vegetation in bright red and dead/burnt vegetation in dark colors. We can also see structures that have been lost; the devastation is clear, striking and terrifying.
DigitalGlobe's Blog:
http://www.digitalglobeblog.com/2016/05/06/digitalglobes-rapid-response-to-the-devastating-fort-mcmurray-wildfire/