

The maps resulting from the study are the first to document forest loss and gain using a consistent method around the globe, at high resolution. They allow scientists to compare forest changes in different countries and monitor annual deforestation. With each pixel in a Landsat image showing an area about the size of a baseball diamond, researchers see enough detail to tell local, regional and global stories.
Prior to this study, country-to-country comparisons of forestry data were not possible at this level of accuracy. Different countries define forests differently, making previous global comparisons difficult with existing inventories.
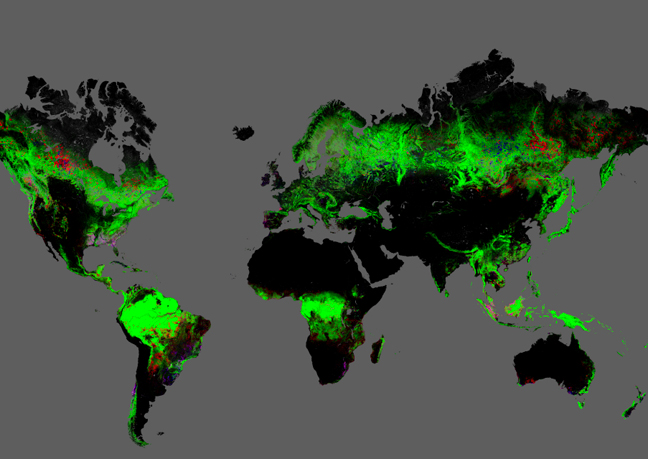
Results from time-series analysis of 654,178 Landsat images in characterizing forest extent and change, 2000–2012.
Trees are defined as all vegetation taller than 5m in height and are expressed as a percentage per output grid cell as ‘2000 Percent Tree Cover’. ‘Forest Loss’ is defined as a stand-replacement disturbance, or a change from a forest to non-forest state. ‘Forest Gain’ is defined as the inverse of loss, or a non-forest to forest change entirely within the study period. ‘Forest Loss Year’ is a disaggregation of total ‘Forest Loss’ to annual time scales.
Reference 2000 and 2012 imagery are median observations from a set of quality assessment-passed growing season observations.
Global Forest Change—Published by Hansen, Potapov, Moore, Hancher et al.
University of Maryland, Department of Geographical Sciences.
"When you put together datasets that employ different methods and definitions, it's hard to synthesize," said Matthew Hansen, whose team at the University of Maryland in College Park, Maryland, led the new study. "But with Landsat, as a polar-orbiting instrument that takes the same quality pictures everywhere, we can apply the same algorithm to forests in the Amazon, in the Congo, in Indonesia, and so on. It's a huge improvement in our global monitoring capabilities."
Hansen and colleagues analyzed 143 billion pixels in 654,000 Landsat images to compile maps of forest loss and gain between 2000 and 2012. During that period, 888,000 square miles (2.3 million square kilometers) of forest were lost, and 309,000 square miles (800,000 square kilometers) regrew. The researchers, including scientists from the University of Maryland, Google, the State University of New York, Woods Hole Research Center, the U.S. Geological Survey (USGS) and South Dakota State University, published their work in the November 15 issue of the journal Science.
Key to the project was collaboration with team members from Google Earth Engine, who reproduced in the Google Cloud the models developed at the University of Maryland for processing and characterizing the Landsat data.
During the study period, Brazil cut its deforestation rate from approximately 15,400 square miles (40,000 square kilometers) per year to approximately 7,700 square miles (20,000 square kilometers) per year.
"That's the result of a concerted policy effort to reduce deforestation, and it sets a standard for the rest of the world," Hansen said.
The team found t the deforestation rate in other countries increased. Indonesia's deforestation rate doubled in the study period, from approximately 3,900 square miles (10,000 square kilometers) per year in 2000-2003 to more than 7,700 square miles (20,000 square kilometers) in 2011-2012.
"Since the first Landsat satellite launched 41 years ago, scientists have been improving their land cover analysis as computers have become more powerful," said Jeff Masek, Landsat project scientist at NASA's Goddard Space Flight Center in Greenbelt, Maryland. "Projects like Hansen's took a big leap forward once USGS made the data freely available on the Internet in 2008."
"This is the first time somebody has been able to do a wall-to-wall, global Landsat analysis of all the world's forests—here they're being cleared, where they're regrowing, and where they're subject to natural disturbances," Masek said, noting that the maps could be routinely updated to aid in carbon accounting and other studies of land cover change.
The maps also illustrate the impact of politics on land cover. On the island of Borneo, the maps clearly show the border between Malaysia and Indonesia. Malaysia's heavy logging along forest roads is visible right up to the Indonesian border, where forests were still largely intact as of 2012. In Côte d'Ivoire, a civil war in 2002 corresponded with intense deforestation of several previously protected nature reserves.
A different pattern of change appears in the southeastern U.S., where landowners harvest trees for timber and quickly plant their replacements.
"Of this eco-region in the southeast, 30 percent of the forest land was regrown or lost during this period," Hansen said. "It's incredibly intensive. Trees are really treated like a crop in this region."
In Alabama, Landsat also detected miles-long streaks of destroyed forest. When the researchers examined the year-by-year record, they found the damage occurred in 2011 after a violent tornado season.
Since 1972, the Landsat program has played a critical role in monitoring, understanding and managing the resources needed to sustain human life such as food, water and forests. Landsat 8 was launched Feb. 11 and is managed jointly by NASA and USGS to continue the 40-plus years of Earth observations.
To view the forest cover maps in Google Earth Engine, visit: http://bit.ly/1aTS9M2 —For more information about the Landsat satellites, visit: http://www.nasa.gov/landsat.