
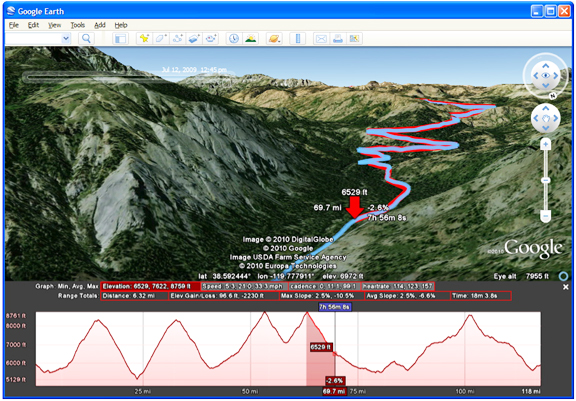
With the release of Google Earth 5.0, the company added the ability to connect your GPS device directly to Google Earth and import your track. Now, with Google Earth 5.2, added is the ability to view elevation, speed, and other data as a graph directly in Google Earth. Just connect your GPS device to upload your track, and select “View Elevation Profile” from the menu. This will bring up elevation and speed graphs. If your GPS device records additional information such as heart rate or cadence, these will also be available to view in the graph. You can also see statistics such as total elevation, maximum slope, and average speed. You can select a portion of your ride and get statistics for just that section.
Google Earth is a “geo-browser," a great tool for exploring places, businesses, and photos around the globe. However, sometimes when you want more information, you may want to click through to a link to see the full Google Places page for a business, or learn more about a photographer whose photo you really enjoy. In the past, this has required opening a link in an external browser to see the full page. For Google Earth 5.2, added is an embedded browser that allows you browse the full web. Click on a link, and the browser pane slides across the screen. When you want to return to the Earth view, just click the “Back” button and you’re back exploring the world!
For Google Earth Pro users, there are powerful tools that enalbe the processing and visualization of large geographic data sets. Google Earth Pro 5.2 brings new features to professional users, including:
- Parcel, demographic, and traffic data layers for the US
- Improved GIS importing
- Automatic generation of super-overlays for very large image files
- Automatic regioning of large point and vector data sets
- Support for MGRS grid system