
NASA Earth Observatory image by Jesse Allen, using near-real-time data provided courtesy of TRMM Science Data and Information System at Goddard Space Flight Center. Caption by Holli Riebeek.
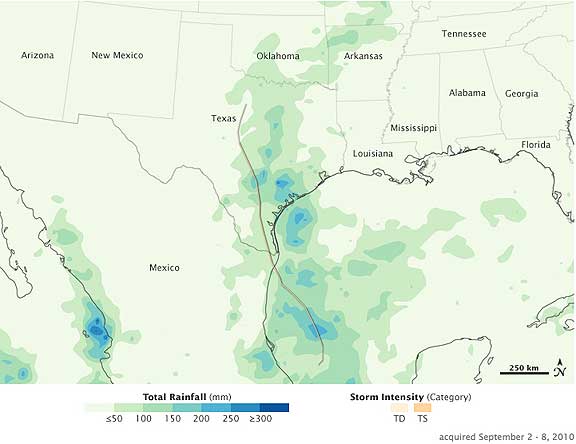
The storm’s path inland over Texas and into Oklahoma and Arkansas is clearly defined in this rainfall image. The image shows rainfall measurements from a variety of satellites, including NASA’s Tropical Rainfall Measuring Mission (TRMM) satellite. The TRMM-calibrated Multi-satellite Precipitation Analysis collated the measurements to estimate total rainfall between September 2 and September 8, 2010. The heaviest rain fell shortly after Hermine came ashore, but a swath of heavy rain also followed the storm north.