
[SatNews] At 11:00 a.m. EDT, the center of Post-Tropical Cyclone Sandy was located about...
...120 miles east of Pittsburgh, Pennsylvania, moving to the west at about 10 mph. Maximum sustained winds have decreased to 45 mph. Sandy is expected to continue its westward track across southern Pennsylvania this afternoon.
SUMMARY OF 500 AM EDT...0900 UTC...INFORMATION
-----------------------------------------------
LOCATION...40.5N 77.0W
ABOUT 15 MILES...24 KM...E OF YORK PENNSYLVANIA.
ABOUT 90 MILES...145 KM...W OF PHILADELPHIA PENNSYLVANIA.
MAXIMUM SUSTAINED WINDS...65 MPH...105 KM/H
PRESENT MOVEMENT...WNW OR 295 DEGREES AT 15 MPH...24 KM/H
MINIMUM CENTRAL PRESSURE...960 MB...28.35 INCHES
WATCHES AND WARNINGS
--------------------
SUMMARY OF WATCHES AND WARNINGS IN EFFECT...
THERE ARE HIGH-WIND WARNINGS IN EFFECT...INCLUDING GALE FORCE WINDS OVER THE COASTAL WATERS OF THE MID-ATLANTIC STATES...NEW YORK AND NEW ENGLAND. STORM WARNINGS ARE IN EFFECT FOR PORTIONS OF THE MID ATLANTIC COASTAL WATERS.
FLOOD AND FLASH FLOOD WATCHES AND WARNINGS ARE IN EFFECT OVER PORTIONS OF THE MID-ATLANTIC AND NORTHEAST STATES.
FOR INFORMATION SPECIFIC TO YOUR AREA...INCLUDING POSSIBLE WATCHES AND WARNINGS...PLEASE MONITOR PRODUCTS ISSUED BY YOUR LOCAL NATIONAL WEATHER SERVICE OFFICE AT WWW.WEATHER.GOV.
DISCUSSION AND 48-HOUR OUTLOOK
MAXIMUM SUSTAINED WINDS ARE NEAR 65 MPH...105 KM/H...WITH HIGHER GUSTS. STEADY WEAKENING IS FORECAST DURING THE NEXT 48 HOURS.
THE ESTIMATED MINIMUM CENTRAL PRESSURE IS 960 MB...28.35 INCHES.
HAZARDS
STORM SURGE...EVEN THOUGH WATER LEVELS ALONG THE COAST HAVE BEEN SUBSIDING...THE COMBINATION OF STORM SURGE AND THE TIDE COULD STILL CAUSE NORMALLY DRY AREAS NEAR THE COAST TO BE FLOODED BY RISING WATERS...ESPECIALLY DURING THE NEXT HIGH TIDE CYCLE. THE WATER COULD REACH THE FOLLOWING DEPTHS ABOVE GROUND AT THE TIME OF HIGH TIDE...
PAMLICO AND ALBEMARLE SOUNDS...2 TO 4 FT DELMARVA PENINSULA AND DELAWARE BAY...2 TO 4 FT UPPER AND MIDDLE CHESAPEAKE BAY...2 TO 4 FT JERSEY SHORE NORTHWARD TO MASSACHUSETTS...1 TO 3 FT
SURGE-RELATED FLOODING DEPENDS ON THE RELATIVE TIMING OF THE SURGE AND THE TIDAL CYCLE...AND CAN VARY GREATLY OVER SHORT DISTANCES. THE SURGE COULD BE ACCOMPANIED BY LARGE AND DANGEROUS WAVES ALONG PORTIONS OF THE COAST EXPOSED TO THE ATLANTIC OCEAN. FOR INFORMATION SPECIFIC TO YOUR AREA...PLEASE SEE PRODUCTS ISSUED BY YOUR LOCAL NATIONAL WEATHER SERVICE OFFICE.
RAINFALL...RAINFALL TOTALS OF 3 TO 6 INCHES ARE EXPECTED OVER FAR NORTHEASTERN NORTH CAROLINA WITH ISOLATED MAXIMUM TOTALS OF 8 INCHES POSSIBLE. RAINFALL AMOUNTS OF 4 TO 8 INCHES ARE EXPECTED OVER PORTIONS OF THE MID-ATLANTIC STATES...INCLUDING THE DELMARVA PENINSULA...WITH ISOLATED MAXIMUM AMOUNTS OF 12 INCHES POSSIBLE. RAINFALL AMOUNTS OF 1 TO 3 INCHES WITH ISOLATED MAXIMUM AMOUNTS OF 5 INCHES ARE POSSIBLE FROM THE SOUTHERN TIER OF NEW YORK STATE NORTHEASTWARD THROUGH NEW ENGLAND.
SNOWFALL...SNOWFALL TOTALS OF 2 TO 3 FEET ARE EXPECTED IN THE MOUNTAINS OF WEST VIRGINIA WITH LOCALLY HIGHER TOTALS TODAY THROUGH WEDNESDAY. SNOWFALL TOTALS OF 1 TO 2 FEET ARE EXPECTED IN THE MOUNTAINS OF SOUTHWESTERN VIRGINIA TO THE KENTUCKY BORDER...WITH 12 TO 18 INCHES OF SNOW EXPECTED IN THE MOUNTAINS ALONG THE NORTH CAROLINA/TENNESSEE BORDER AND IN THE MOUNTAINS OF FAR WESTERN MARYLAND.
SURF...DANGEROUS SURF CONDITIONS WILL CONTINUE FROM FLORIDA THROUGH NEW ENGLAND FOR THE NEXT COUPLE OF DAYS.
[SatNews] SEVENTH UPDATE—On October 29, 2012, Hurricane Sandy approached the densely populated U.S. East Coast.
An estimated 60 million Americans were expected to be affected by rain, wind, snow, or ocean storm surges from the storm. The Visible Infrared Imaging Radiometer Suite (VIIRS) on the Suomi NPP satellite acquired this natural-color image of the storm at 1:35 p.m. Eastern Daylight Time (17:35 Universal Time) on October 29.
At 2:00 p.m. Eastern Daylight Time on October 29, the U.S. National Hurricane Center (NHC) reported that Hurricane Sandy was located about 110 miles (180 kilometers) southeast of Atlantic City, New Jersey, and about 175 miles (285 kilometers) south-southeast of New York City. The storm had maximum sustained winds of 90 miles (150 kilometers) per hour. The storm was moving toward the northwest at about 28 miles (44 kilometers) per hour. The NHC stated that Sandy could change into a wintertime low-pressure system later in the day, but cautioned that this would not weaken the storm prior to landfall.
The NHC forecast that Hurricane Sandy would come ashore on the evening of October 29, along the coast of southern New Jersey or Delaware. The NHC warned of multiple hazards associated with the storm. Hurricane-force winds were predicted for the Mid-Atlantic States, including New York City, with tropical storm-force winds from Virginia to Canada. A storm surge, combined with astronomically high tides (at full Moon), promised to flood coastal areas with waters as much as 11 feet (3 meters) above normal. Sandy was forecast to drop as much as 8 inches (20 centimeters) of rain, and the mountains of Appalachia were expected to receive up to 3 feet (1 meter) of snow.
The NHC urged potentially affected residents to consult their local National Weather Service forecast offices for more information. Government officials urged residents to heed evacuation warnings, and hundreds of thousands of people had fled their homes by October 29, CNN reported. More than 100,000 customers in seven states had already lost electrical power. In the days leading up to the storm, as residents stocked up on supplies and utility companies called in reinforcements from across the country, the U.S. Geological Survey deployed more than 150 storm-surge sensors along the Atlantic Coast to monitor Sandy’s effects in real time.
To witness Sandy's tracking over the past three days, SatNews highly recommends the link below, which leads to the NOAA Environmental Visualization Laboratory website. The Real-Time GOES East Regions offers an animation of the images of the Northern Hemisphere captured by the GOES East satellite every 30 minutes and the entire Western Hemisphere every three hours. Simply follow the simple directions on the page to view the available imagery which reveal the extent, breadth and power of this super storm.
http://www.nnvl.noaa.gov/GOESEast.php.
DC's ABC News 7's StormWatch7 Weather Blog from Alex Liggitt (Twitter @alexliggitt) published a look at where...
...Hurriance Sandy may be at 7:00 p.m. this evening, Monday, October 29th. The hurricane is expected to come ashore in central-south New Jersey. In the image below, the dark red indicates winds 50mph in the Washington DC area and purple winds 70 mph+ along the Jersey shore, Long Island and New York City area. It is also being reported by other media outlets that as many as 500,000 citizens are now with power, as of this writing.
Google.org's Crisis Response map reveals the project path of Hurricane Sandy as it comes ashore and initiates its treck to the northwest and then northwards. This map is available at this direct link to the Official google.org blog.
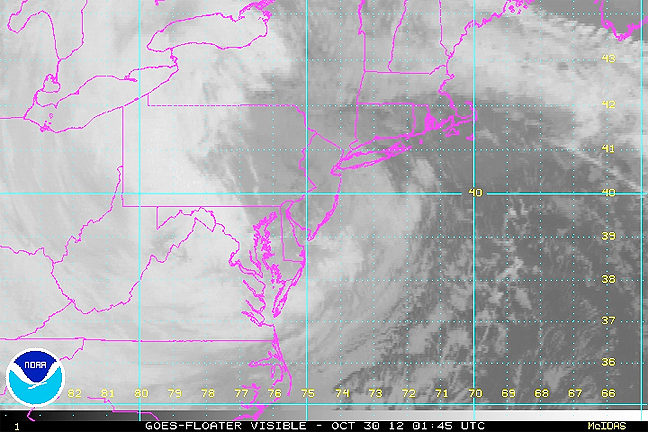
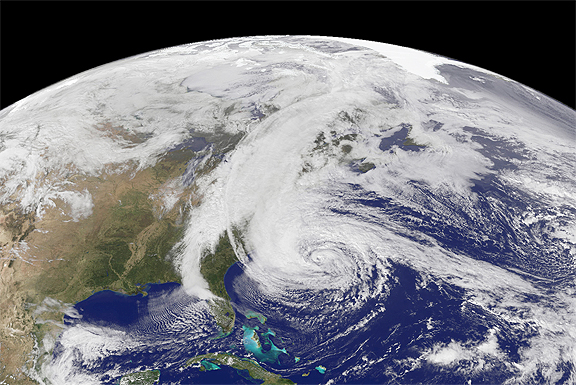
The Geostationary OperationalEnvironmental Satellite 13 (GOES-13) captured this natural-color image of...
...Hurricane Sandy at 1:45 p.m. Eastern Daylight Time (17:45 Universal Time) on October 28, 2012. Note how a line of clouds from a continental weather system runs south to north along the Appalachian Mountains, approaching from the west to meet the offshore storm.
Cameras on another geostationary satellite (GOES-14) collected “super rapid scan” images—one every minute from 7:15 a.m. until 6:26 p.m. EDT—which were compiled into a time-lapse video available on YouTube. In the animation, light from the changing angles of the Sun reveal the structure of the clouds and the details of the storm’s motion from dawn to dusk.
At 2:00 p.m. EDT, shortly after the still image above was acquired, the U.S. National Hurricane Center reported that Sandy was located at 32.8 degrees North and 71.9 degrees West, about 575 miles (930 kilometers) south of New York City. Maximum sustained winds were observed at 75 miles (120 kilometers) per hour, and the barometric pressure at the center of the storm was 951 millibars (28.08 inches).
The Visible Infrared Imaging Radiometer Suite (VIIRS) on the Suomi NPP satellite acquired this...
...natural-color image of Hurricane Sandy at 1:50 p.m. Eastern Daylight Time (17:50 Universal Time) on October 28, 2012. Suomi NPP was launched one year ago today.
Just moments after this image was acquired, the U.S. National Hurricane Center reported that Sandy’s center was located at 32.8 degrees North and 71.9 degrees West, about 575 miles (930 kilometers) south of New York City. Maximum sustained winds were observed at 75 miles (120 kilometers) per hour, and the barometric pressure at the center of the storm was 951 millibars (28.08 inches). The storm was predicted to make landfall in New Jersey on October 29, midway between Philadelphia and New York City.
UPDATE 2! — At noon, Eastern Daylight Time (16:00 Universal Time), on October 28, 2012, the...
...Moderate Resolution Imaging Spectroradiometer (MODIS) on NASA’s Terra satellite acquired the following image of Hurricane Sandy off the southeastern United States.
At 11:00 a.m. local time (one hour before the image was captured), the U.S. National Hurricane Center reported that the storm was located at 32.5 degrees North and 72.6 degrees° West, about 250 miles (400 kilometers) southeast of Cape Hatteras, North Carolina, and 575 miles (930 kilometers) south of New York City. Maximum sustained winds were 75 miles (120 kilometers) per hour, and the central pressure was 951 millibars (28.08 inches).
Forecasters predicted that the storm would continue heading north-northeast until the morning of October and then take a hard turn to the northwest into the coastaline of Delaware, New Jersey, or New York. The wind field from the storm was said to stretch 500 to 700 miles and was likely to affect an area from South Carolina to Maine, and as far inland as the Great Lakes. The storm has already caused significant damage in the Bahamas, Cuba, Jamaica, Puerto Rico, the Dominican Republic, and Haiti; at least 65 lives have been lost to the storm.
Credit: NOAA/UWI/SSEC
------------------------------
AT 500 AM EDT...0900 UTC...THE CENTER OF POST-TROPICAL CYCLONE SANDY WAS LOCATED NEAR LATITUDE 40.5 NORTH...AND LONGITUDE 77.0 WEST. THE POST-TROPICAL CYCLONE WAS MOVING TOWARD THE WEST-NORTHWEST AT 15 MPH...25 KPH. A WEST-NORTHWEST MOTION WITH REDUCED FORWARD SPEED IS EXPECTED TODAY INTO WESTERN PENNSYLVANIA...WITH A TURN NORTH INTO WESTERN NEW YORK TONIGHT. THE CYCLONE WILL MOVE INTO CANADA WEDNESDAY.
-------
WIND...GALE-FORCE WINDS WILL CONTINUE EARLY TODAY OVER PORTIONS OF THE MID-ATLANTIC STATES FROM VIRGINIA NORTHWARD THROUGH NEW ENGLAND.
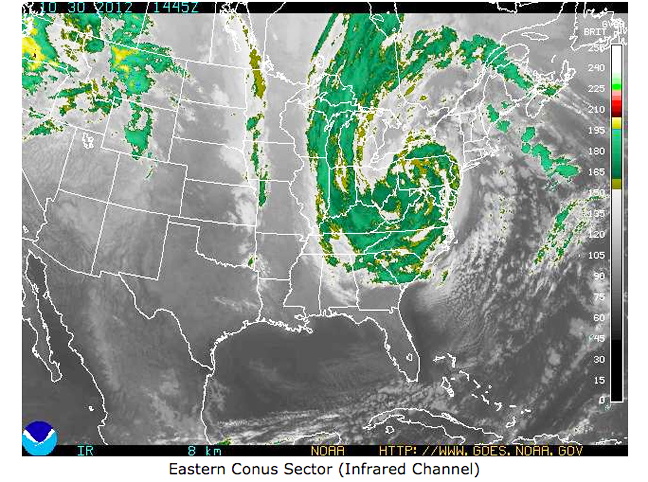
The latest image via GOES East of Hurricane Sandy after landfall
@ 01:45 UDC on October 30, 2012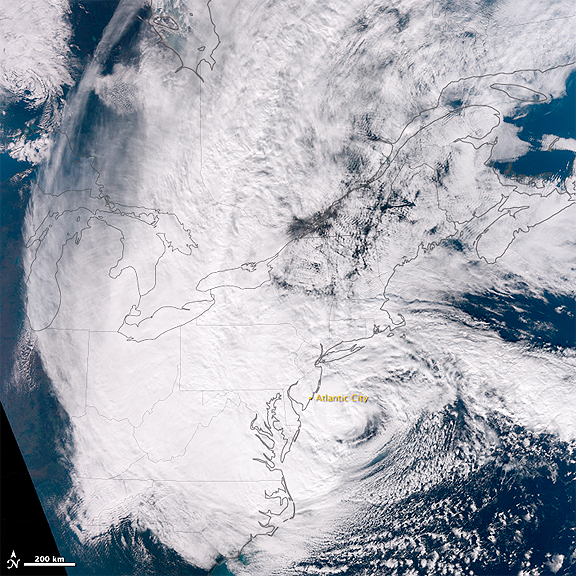
NASA Earth Observatory image by Jesse Allen, using Suomi NPP VIIRS data provided by Cooperative Institute for Meteorological Satellite Studies (CIMSS). Suomi NPP is the result of a partnership between NASA, NOAA and the Department of Defense.
Caption by Michon Scott.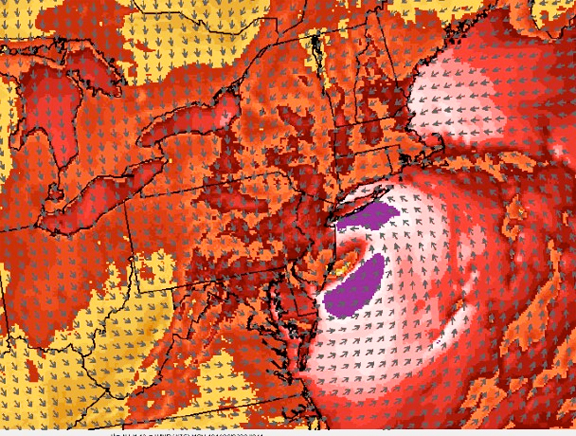
NASA Earth Observatory image by Robert Simmon with data courtesy of the NASA/NOAA GOES Project Science team.
Caption by Mike Carlowicz.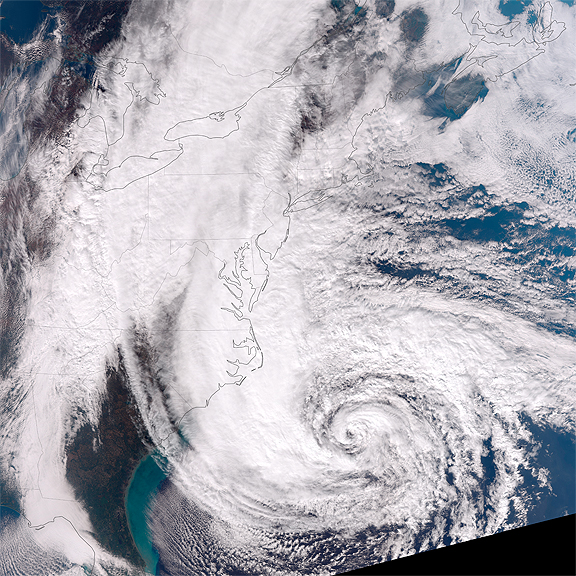
NASA Earth Observatory image by Jesse Allen, using Suomi NPP VIIRS data provided by Cooperative Institute for Meteorological Satellite Studies (CIMSS). Suomi NPP is the result of a partnership between NASA, NOAA and the Department of Defense.
Caption by Michael Carlowicz.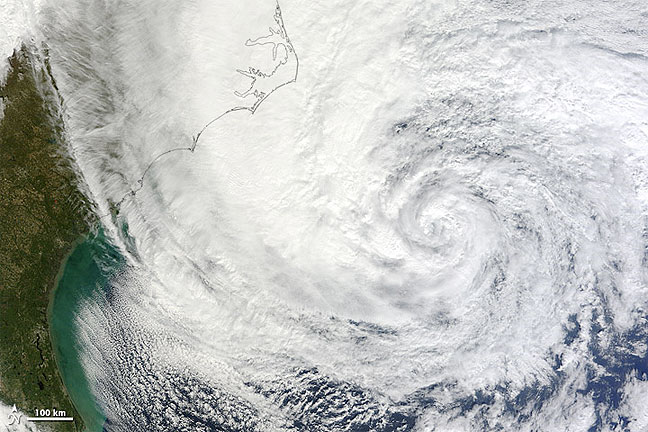
NASA image courtesy LANCE MODIS Rapid Response Team at NASA GSFC.
Caption by Michael Carlowicz.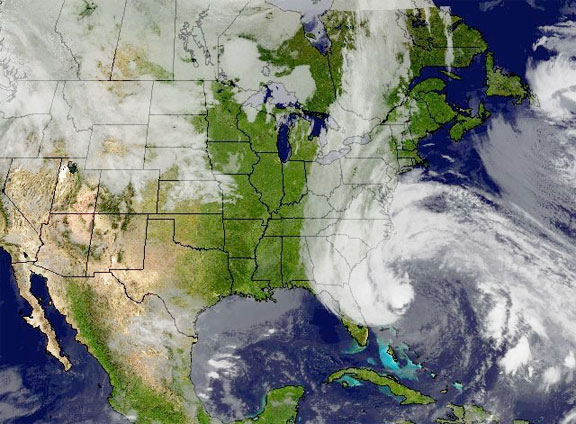
This image was created combining NOAA's GOES-13 and GOES-15 satellite imagery on Oct. 27 and shows the cloud cover from Hurricane Sandy interacting with the long line of clouds associated with the cold front approaching the eastern U.S. The composite image was created using SSEC's McIDAS software and NOAA's GOES imager satellite imagery.