
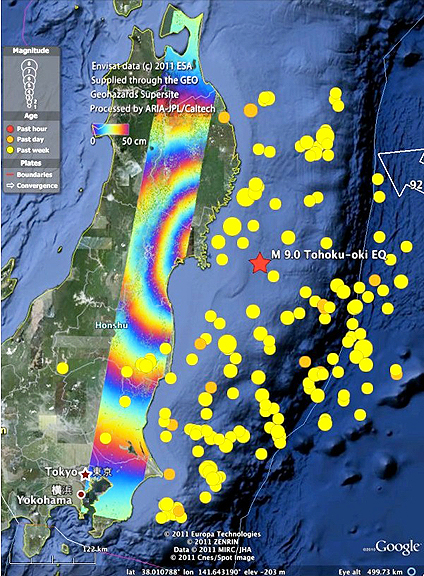
Envisat Advanced Synthetic Aperture Radar coseismic interferogram from descending track 347, processed by JPL/Caltech ARIA project using ROI_PAC. Data acquired on 19 February and 21 March 2011, spanning the main shock of the magnitude 9 earthquake and the magnitude 7.9 aftershock that occurred in Japan on 11 March 2011. One colour cycle represents 50 cm of motion in the radar line of sight (approximately west at 41 degrees from the vertical). The seismicity plot is from the US Geological Survey. (The red star denotes the quake's epicentre, and the yellow circles represent aftershocks). Credits: Based on ESA data - JPL/Caltech ARIA project (E. Fielding, Principal Scientist JPL/Caltech; S. Yun, Research Scientist JPL/Caltech; P. Agram, KISS Postdoctoral Fellow Caltech)
Now scientists are using ESA’s space radars to improve our understanding of tectonic events. Scientists are calling on data from the advanced radar on ESA’s Envisat satellite to map surface deformations caused by the magnitude-9 earthquake. Studying data acquired on February 19th and March 21st, scientists from NASA’s Jet Propulsion Laboratory have detected a ground shift of about 2.5 m eastwards and a downward motion of Honshu Island’s east coast. Scientists from Italy’s Istituto Nazionale di Geofisica e Vulcanologia have used the same Envisat data to show a large portion of the surface displacement, with a maximum shift of 2.5 m.
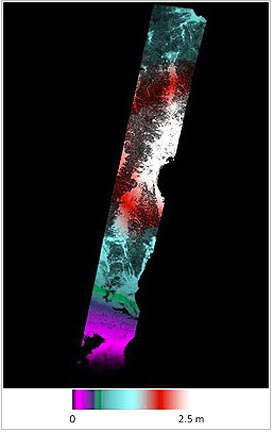
An interferogram based on Envisat Advanced Synthetic Aperture Radar of the earthquakes that struck Japan beginning on 11 March 2011. Marco Chini and Christian Bignami have processed a strip composed of 13 Envisat frames (track 347, descending orbit) over Honshu island (the result is in the framework of ‘Tohoku-oki INGV Team’, lead by Salvatore Stramondo). The interferogram covers most of the epicentre region and shows a large portion of the surface displacement field. The frames partially overlap so that the overall length is about 800 km. The whole strip has been unwrapped to measure the Line Of Sight (of the satellite) surface movement. The maximum displacement reaches about 2.5 m relative to a reference point within the entire frame strip located nearby the southern boundary. Credits: Based on ESA data -The Istituto Nazionale di Geofisica e Vulcanologia (S. Stamondo, M. Chini and C. Bignami)
Another veteran ESA satellite is also contributing to the Japan radar coverage. After 16 productive years, ERS-2 will end its mission this year, but its repeat cycle was fortuitously changed earlier this month from 35 days to 3 days to collect innovative radar information. Its three-day repetition is providing partial coverage over Japan, north of Sendai. Collection of ERS-2 radar data over this area began after the main earthquake with the aim of mapping the aftershocks. Scientists are now working on these data. This disaster marks the first time that multiple space agencies – ESA, the German Aerospace Center and the Japan Aerospace Exploration Agency – are openly providing SAR data for understanding tectonic processes under the GeoHazard Supersites initiative, coordinated by the Group on Earth Observations.
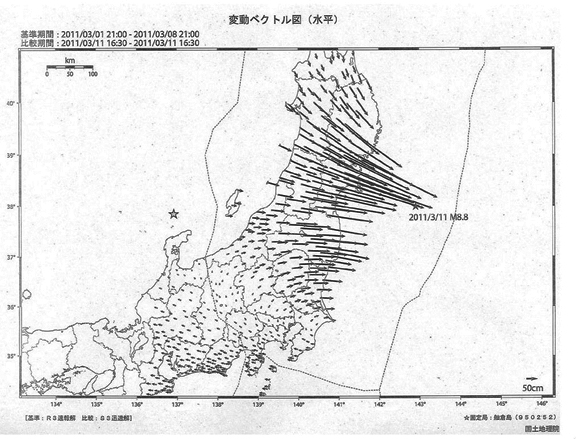
Co-seismic displacement of Japan earthquake on 11 March 2011 from GPS data by GEONET, reference provided by Prof. Hashimoto. This displacement chart shows the direction of ground movement, as part of the GeoHazard Supersites initiative. Credits: GEONET
The initiative is stimulating international efforts and fostering collaboration between space agencies, in-situ data providers and users to further our understanding of geological risks. The initiative provides scientists with access to in-situ and spaceborne data, including 20 years of satellite radar observations. This joint collaboration, incorporating all available space and ground data, is an efficient way to make significant progress in assessing the area’s future vulnerability while reconstruction is under way.